Cambrian Limestone Aquifer dynamics
The Cambrian Limestone Aquifer covers a large area of about 550,000 square kilometers, stretching eastward from the Northern Territory into western Queensland. This is an area about the size of France or a little more than half the area of the Murray-Darling Basin. Unlike the Murray-Darling Basin, the area is sparsely populated, with fewer than 50,000 people living there, as opposed to the Murray-Darling’s 2.4 million people (MDBA 2025). Similarly, water use for irrigation and other purposes is much lower than in the Murray-Darling Basin, with total annual groundwater extraction across the Cambrian’s area estimated at around 30 GL per year, compared to the Murray-Darling’s 8,000-14,000 GL per year, 800-1800 GL per year of which is groundwater (MDBA 2024).
Unlike the Murray-Darling Basin, which has a dense network of rivers and streams, the Cambrian Limestone Aquifer is mostly made up of underground water stored in many different porous rock formations, with comparatively fewer surface water features. The Tindall Limestone Aquifer is one element of the larger Cambrian Limestone Aquifer system. Scientists have studied its recharge (how water enters the system), storage capacity, and overall behaviour using a variety of methods, including integrated models that combine groundwater and surface water data, chemical analyses like chloride mass balance, and satellite-based gravity measurements from GRACE.
Despite this research, considerable uncertainty remains about the aquifers that make up the Cambrian due to its large area, remote location, low population, low water extraction and limited gauging. The high climate variability of northern Australia drives changes in aquifer water levels and requires long-term records to separate true trends from natural variation. For example, estimates of how much water recharges the aquifer each year range from as low as 2 GL to as high as 23,743 GL, with average and middle values around 995 and 469 GL, respectively (CSIRO, 2023). However, there are limited long-term aquifer or river flow records and those that exist are clustered in areas of higher population (e.g. Katherine).
Recent claims of aquifer “drying”
Researchers from Griffith University have analysed satellite data beginning in the early 2000s and suggested that the aquifer is drying (Ndehedehe et al., 2025). The researchers’ media releases and associated media coverage suggest this drying is linked to water extraction and the researchers raise alarms about the long-term sustainability of how groundwater is managed in the Northern Territory. However, a closer look shows that the researchers published data do not back up the leap they make from observing drying trend to blaming human water extraction as a cause. Indeed, the “drying” is within the range of natural variation for the region and was reversed in the period from 2023 to the present, which the researchers do not include in their study. Moreover, the researchers undertake no analysis at all that could attribute a period of aquifer drying to water extraction. Globally, researchers note an issue that “Groundwater depletion has been ascribed to groundwater pumping, often ignoring influences of direct and indirect consequences of climate variability.” (Thomas, 2019)
Three major limitations in the study undermine the the Griffith University researchers media claims:
- The study cherrypicks the periods it uses for trend analysis, not including more recent data that reveal the ‘drying’ trend is likely natural variation
- The study uses data and methods that cannot distinguish human effects from natural climate variability, no analysis of extraction is possible because the human signal is too small to be seen by the methods used (and the researchers don’t attempt any attribution analysis in their study)
- The study does not adequately account for uncertainties in its data and methods.
Trend analysis in variable natural systems
A classic and well-known finding in environmental research is that simple linear trend estimates are dependent on the chosen time window (Weatherhead et al. 1998). If a researcher cherry-picks convenient start and end years, a noisy time series can be made to show almost any trend. Often, the inclusion or exclusion of just a few years (especially extreme years at the boundaries) may reverse the sign or significance of the trend This endpoint sensitivity has been demonstrated across many contexts in the environmental sciences. For example, Hannaford et al. (2013) applied a multi-temporal trend analysis to long European river flow records, fitting trends for every possible combination of start and end year. Their results showed that the magnitude and even direction of detected trends varied dramatically with the time window: short-term trends were often positive or negative purely due to decadal fluctuations, and many trends reported in earlier studies were not representative of long-term change. What looked like a significant increase or decrease in flow over a few decades disappeared or even reversed when a longer record was considered. This finding underscores that an apparent “trend” can often be an artifact of the chosen period. By selectively reporting a period that yields a strong trend, a researcher can craft a narrative not supported by the full data: the “researcher has the power to select the fit interval, which allows her or him to suppress certain fit solutions and favor other solutions.” (Mudelsee, 2019) Standard research methodologies for good science recommend examining all possible periods or using sliding windows to avoid such one-off results.
The Griffith University researchers claims of “drying” focus on a period starting in 2011, which follows an exceptionally wet La Niña phase in 2010-2012 that caused a large spike in aquifer storage. They end their trend analysis in 2022, shortly after a dry period where consecutive poor wet seasons in 2018–2020 prevented the usual wet-season groundwater rise and left a number of aquifers in the Cambrian formation at their lowest in more than 20 years and at least one at its lowest on record (BOM, 2020a). This start and endpoint selection guarantees a finding of “drying”, but does not provide any information about whether there really is a real, long-term “drying” trend. The researchers justify their choice of a 2011 break point because it is “based on the two notable hydrological periods of the last 20 years in Australia usually classified as ‘big dry’ (pre-2010) and ‘big wet’ (post-2010)” (Ndehedehe et al., 2025, p.8). However, this justification is flawed because the “big wet” and “big dry” periods characterise the climate of southern, particulary south-eastern, Australia, not northern Australia where the Cambrian Limestone Aquifer is located. Figure 1 shows the October to April wet-season rainfall anomalies for the Cambrian Limestone Aquifer area from 1900 to 2023. Two important points are evident:
- The “big dry” and “big wet” periods do not apply to the Cambrian Limestone Aquifer area. The area of the Cambrian, like most of the monsoonal north of Australia was uncharacteristally wet during the south-east’s “big dry”; 2011-2012 was unusually wet across the whole of Australia; however, the period from 2013 to 2022 has five unusually dry years.
- The last 30 years have been considerably wetter than most of the 20th century. The shallow and unconfined aquifers that are part of the Cambrian Limestone Aquifer system respond quickly to rainfall, so the long-term wetting trend is likely to have increased aquifer storage for these aquifers over time. “Rejected recharge”, where an aquifer is fully saturated resulting in it overflowing, in the Tindall Limestone Aquifer part of the Cambrian system has contributed to flooding in the Katherine area during this period (Rooke, 2024).
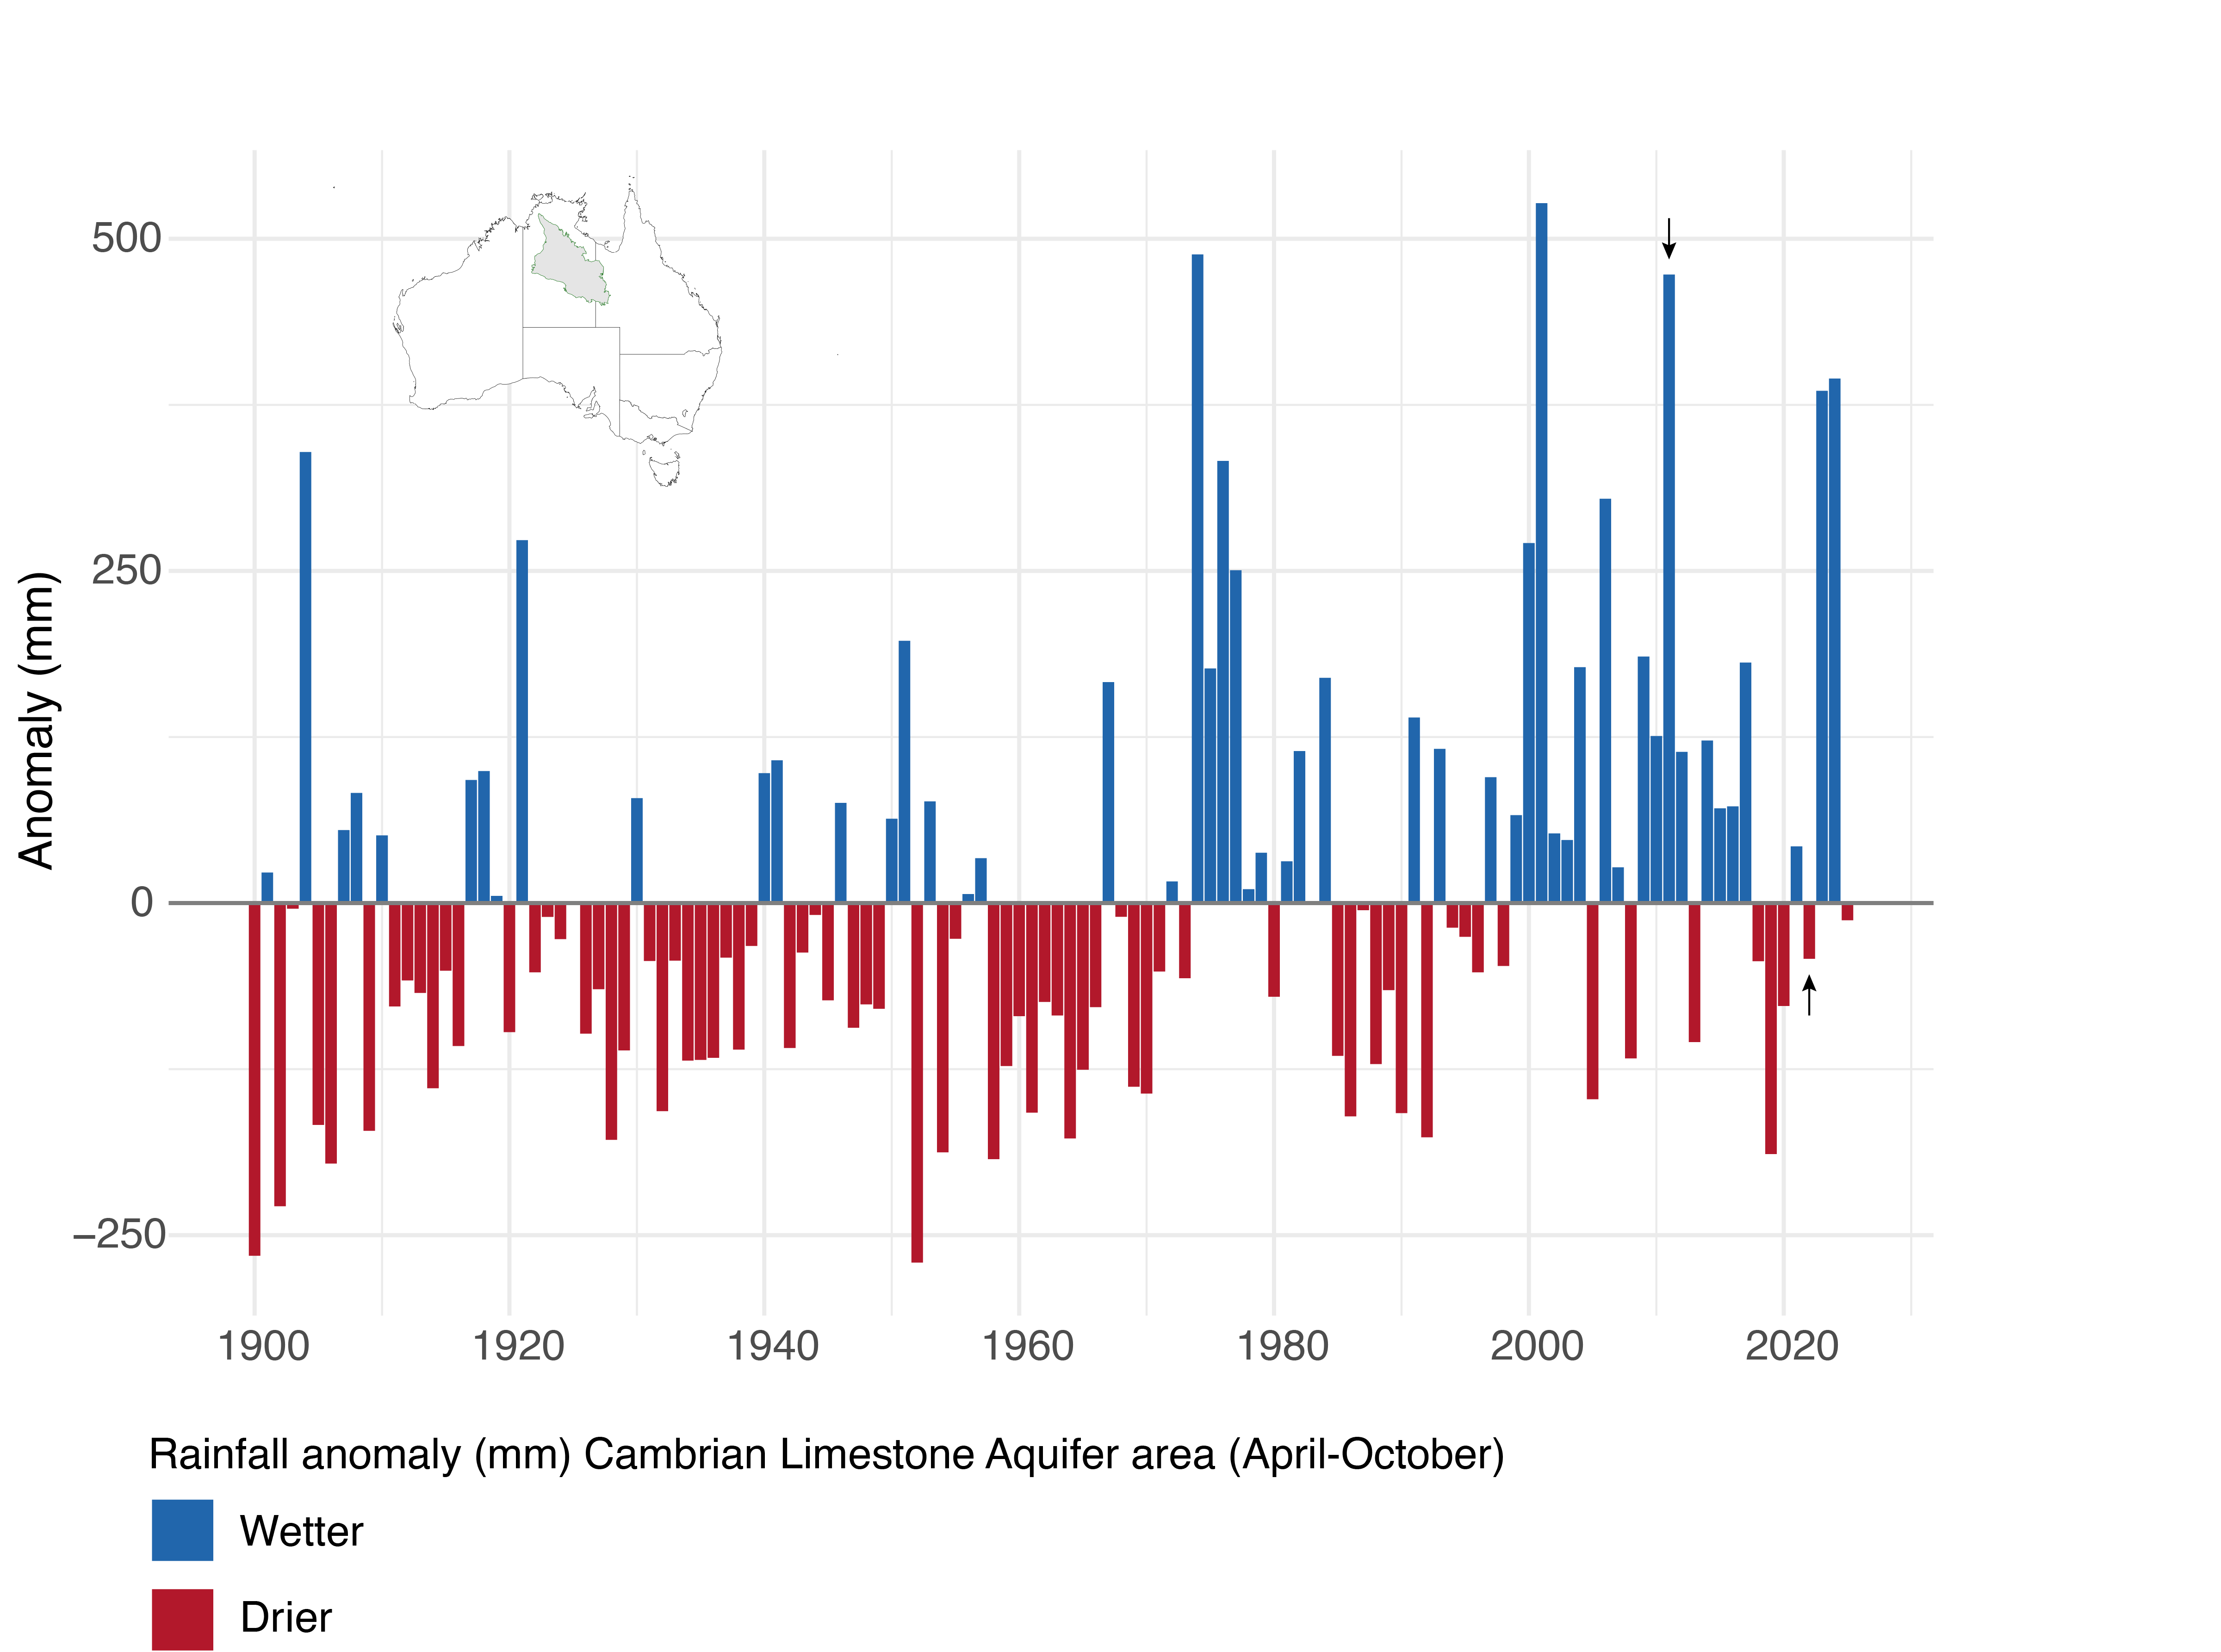
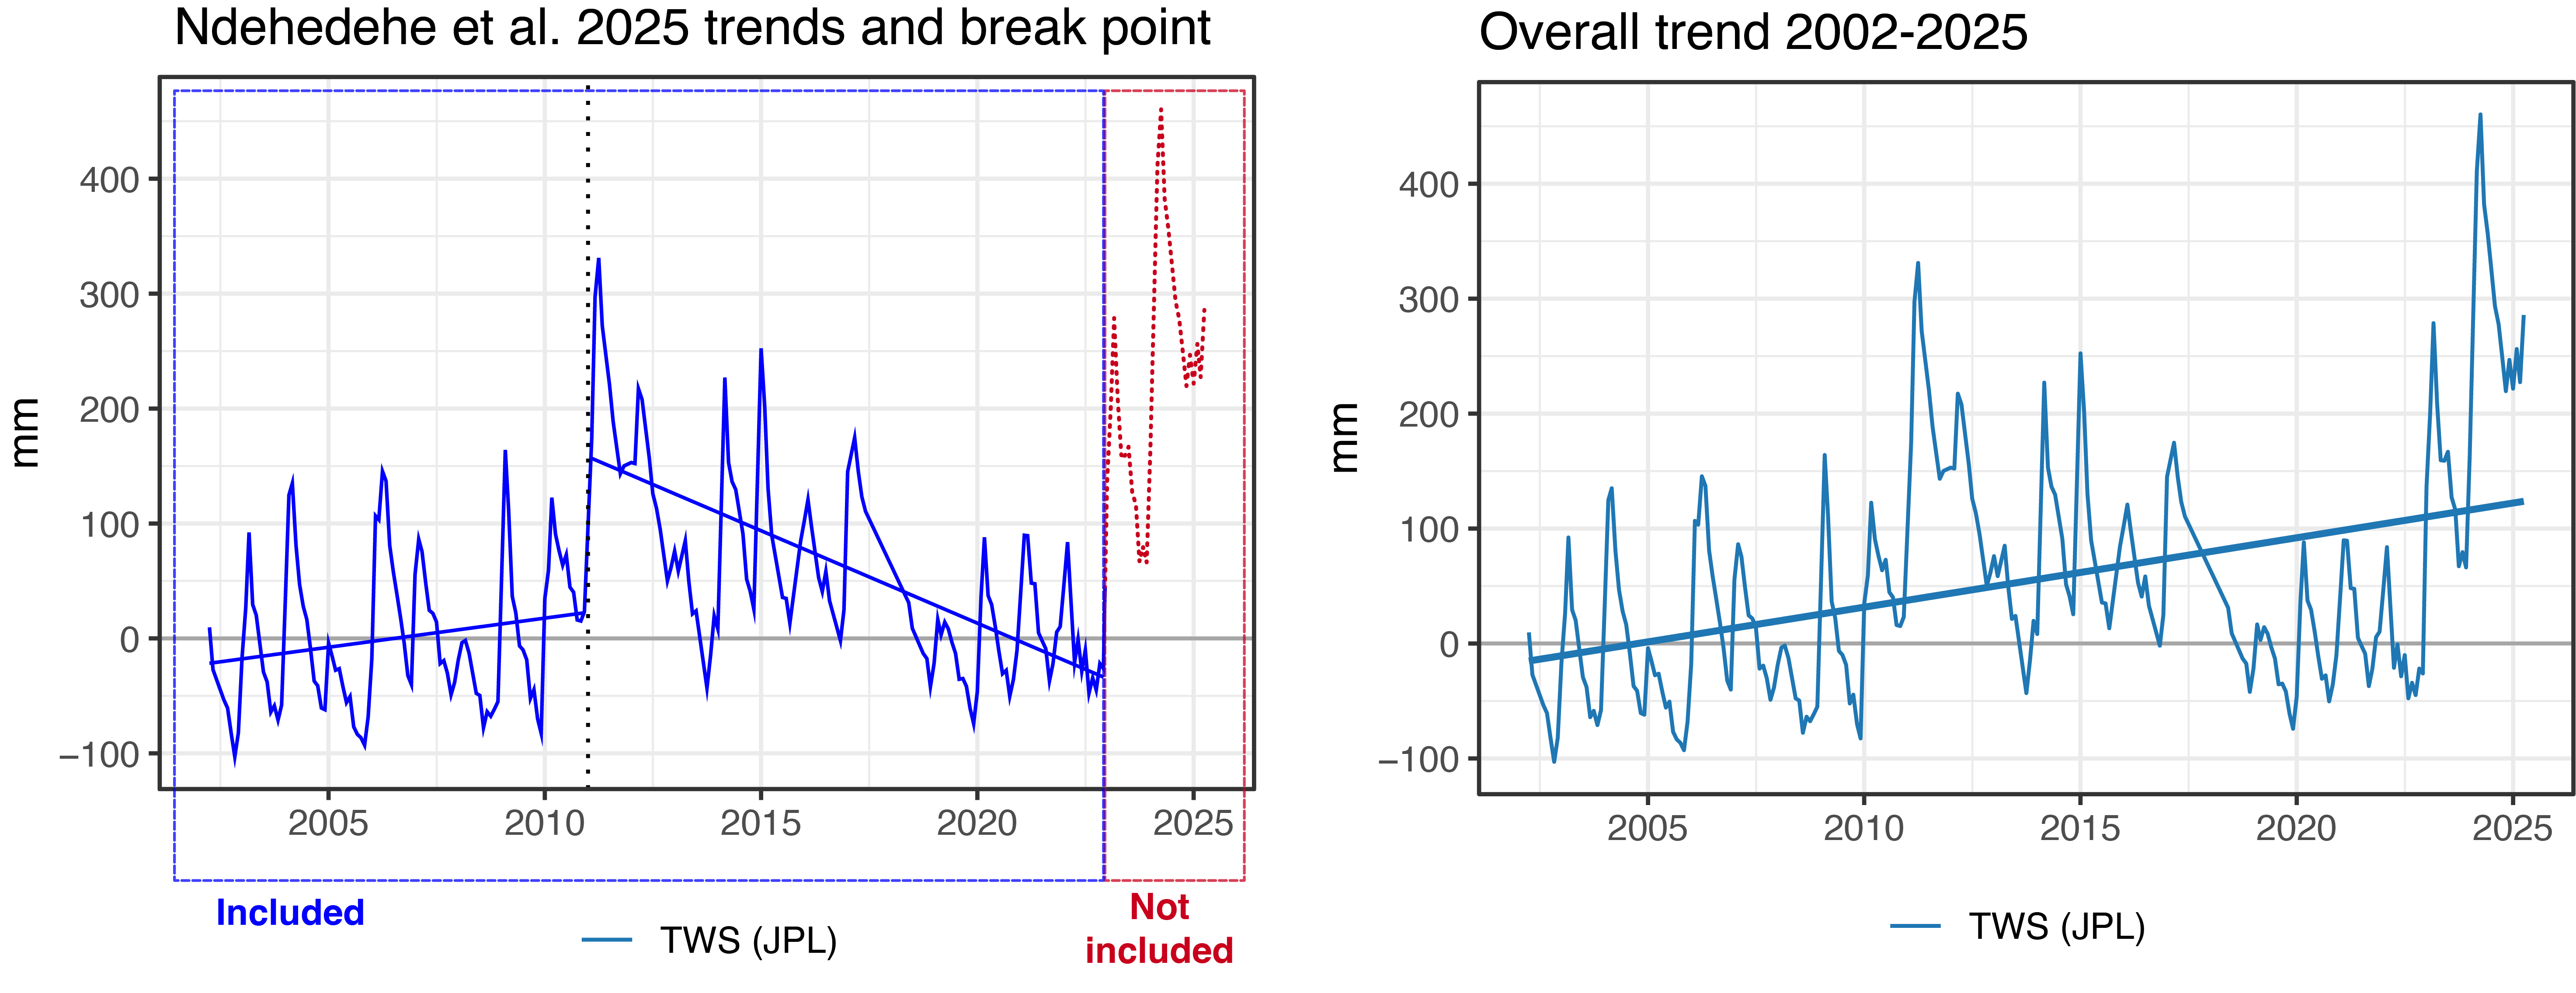
Consistent with the anomalies in Figure 1, one of the same datasets from the GRACE and GRACE-FO satellite missions used by the Griffith University researchers shows the same pattern post-2022 as the rainfall data. The 2022-2023 and 2023-2024 wet seasons in northern Australia were respectively the 6th and 9th wettest on record (BOM 2023, 2024). Figure 2 shows the terrestrial water storage anomaly for the Cambrian Limestone Aquifer area from 2002 to May 2025. The figure shows a clear peak in terrestrial water storage around 2011-2012, followed by a decline to a low point around 2020, and then a recovery in 2023 and 2024. This recent recovery is not included in the Griffith University researchers’ analysis, which ends in 2022. When it is included the overall trend across the period in shows an annual increase in terrestrial water storage of around 3.3 km³, not the decrease of a similar order of magnitude claimed by the Griffith University researchers.
Terrestrial water storage includes all forms of water in the landscape: surface water, soil moisture, groundwater, snow and ice. In the Cambrian Limestone Aquifer area, groundwater is the dominant component of terrestrial water storage. The GRACE satellites measure changes in gravity caused by shifts in mass, mostly from water moving between stores like groundwater, soil moisture, surface water (lakes and rivers), snow, and ice. The changes are reported as “water-equivalent thickness” anomalies—basically, how much has changed compared to an average baseline period. GRACE data capture the total water picture, so groundwater is estimated by subtracting modelled estimates of other components (like soil moisture or surface water) using tools like global land models. This subtraction introduces extra uncertainty (dealt with below).
Identifying a signal and attributing aquifer changes to human extraction
GRACE data show that terrestrial water storage has changed, but not why. To figure out causes—for example, if human pumping is to blame—extra modelling and analysis are needed that accounts for natural factors (e.g., rainfall patterns, climate cycles like El Niño), time delays in effects, and real data on water use. Even with downscaling GRACE cannot separate human from natural drivers in places like Australia. The Griffith University researchers do not do this kind of analysis in their study, so they cannot support their media claims associating human extraction with observed drying trend. In fact, the only link they can make between extraction and drying is the timing: the drying trend starts around when water extraction licences were issued. A coincidence in timing does not prove causation, especially when no actual water use data are analysed in the concidence relates to water licencing not use – in the Northern Territory, water that is allocated can take years to be used. For example, the controversial licence at Singleton Station is still not extracting water for agriculture years after the licence was granted.
Attributing change in terrestrial water storage to human extraction is especially tricky in places like the Cambrian Limestone Aquifer area, where natural climate variability is large and water use is small. The Griffith University researchers’ study finds a drying trend of about 6.28 to 8.20 km³ per year in total water storage and about 3.88 km³ per year in groundwater storage from 2011 to 2022. To put this in perspective, water extraction across the same area has recently averaged around 0.03 km³ per year or 270 times smaller than the terrestrial water storage trend and 130 times smaller than the groundwater storage trend. Even the standard errors in the trends calculated by the researchers (0.29 to 0.75 km³ per year) are 10 to 25 times bigger than the upper-bound use and more than 3 times the full entitlement amounts (~0.08 km³ per year), which are not being used. Consequently, extraction cannot be identified or “seen” in the GRACE data contrary to many media reports.
Researchers using GRACE data during the Millennium Drought in the Murray-Darling Basin only measured overall drought levels across the whole Basin and did not report irrigation changes (Leblanc, 2009). Again, this is because the irrigation signal was too small to be detected above the noise of the changes caused by the Millenium Drought. Total surface water use in Murray-Darling is between 8 and 14 km³ per year and groundwater use around 0.8 to 1.8 km³ (MDBA 2024), yet the GRACE analysis showed a terrestial water storage deficit of 140 km³ and a maximum deficit of 240 km³ (Leblanc, 2009). In the Cambrian Limestone Aquifer area, where use is 200 to 270 times smaller than observed losses, it is even clearer that extraction is not detectable as a driver using these methods.
Uncertainty in study data and methods
GRACE observes gravity changes over large footprints (hundreds of kilometres). To say anything about sub‑basin or aquifer‑unit behaviour, researchers must post‑process: filtering to remove noise and stripes, applying scale factors to correct signal loss, “mascon” inversions, gap‑bridging between the two missions, GRACE and GRACE‑FO where there were no GRACE satellite data, and often statistical downscaling to finer grids. Each step helps, but each adds model dependence and uncertainty that must be propagated. That is standard in the literature (Landerer, 2012).
At basin to regional scales, GRACE has a strong track record: ice‑sheet mass change in Greenland and Antarctica; U.S. drought indicators used operationally; Australian drought studies in the Murray–Darling; and groundwater depletion in India and California. Those are all “big signal” applications where large areas average out local noise. That does not make GRACE data infallible; it makes them useful when methods, assumptions and uncertainty are transparent.
To infer groundwater from GRACE’s total terrestrial water storage (TWS), studies typically subtract modelled soil‑ and surface‑water components (for example from GLDAS/AWRA‑L) and sometimes downscale TWS using machine learning with rainfall/ET/runoff covariates. That can work, but it imports the land‑surface model’s biases and the downscaler’s assumptions; both should be carried through to confidence intervals and tested in sensitivity analysis. Recent work that downscaled GRACE over the Cambrian Limestone Aquifer (CLA) by some of the same authors shows the point: the authors tied GRACE to Australian Water Outlook fluxes and validated against a small set of bores—useful, but uncertainty‑laden, finding only a weak correlation between their water budget model and downscaled GRACE (Kalu et al., 2024).
GRACE data are useful for very large, basin-scale analyses of major changes in terrestrial water storage like those from the Millennium Drought in the Murray-Darling Basin; to draw conclusions about smaller areas or smaller changes, researchers have to refine the data through processes like downscaling, filling in gaps, and subtracting model estimates, which introduces more uncertainty. That does not mean GRACE data are not useful. They have been used to track mass changes in ice sheets and glaciers in Greenland and Antarctica, monitor droughts in the US and Australia, and assess groundwater depletion in places like India and California. They can help verify if computer models accurately capture big regional water swings.NT Government’s recent model recalibration (known as DR3) incorporated GRACE data as part of checking sensitivities and uncertainties.
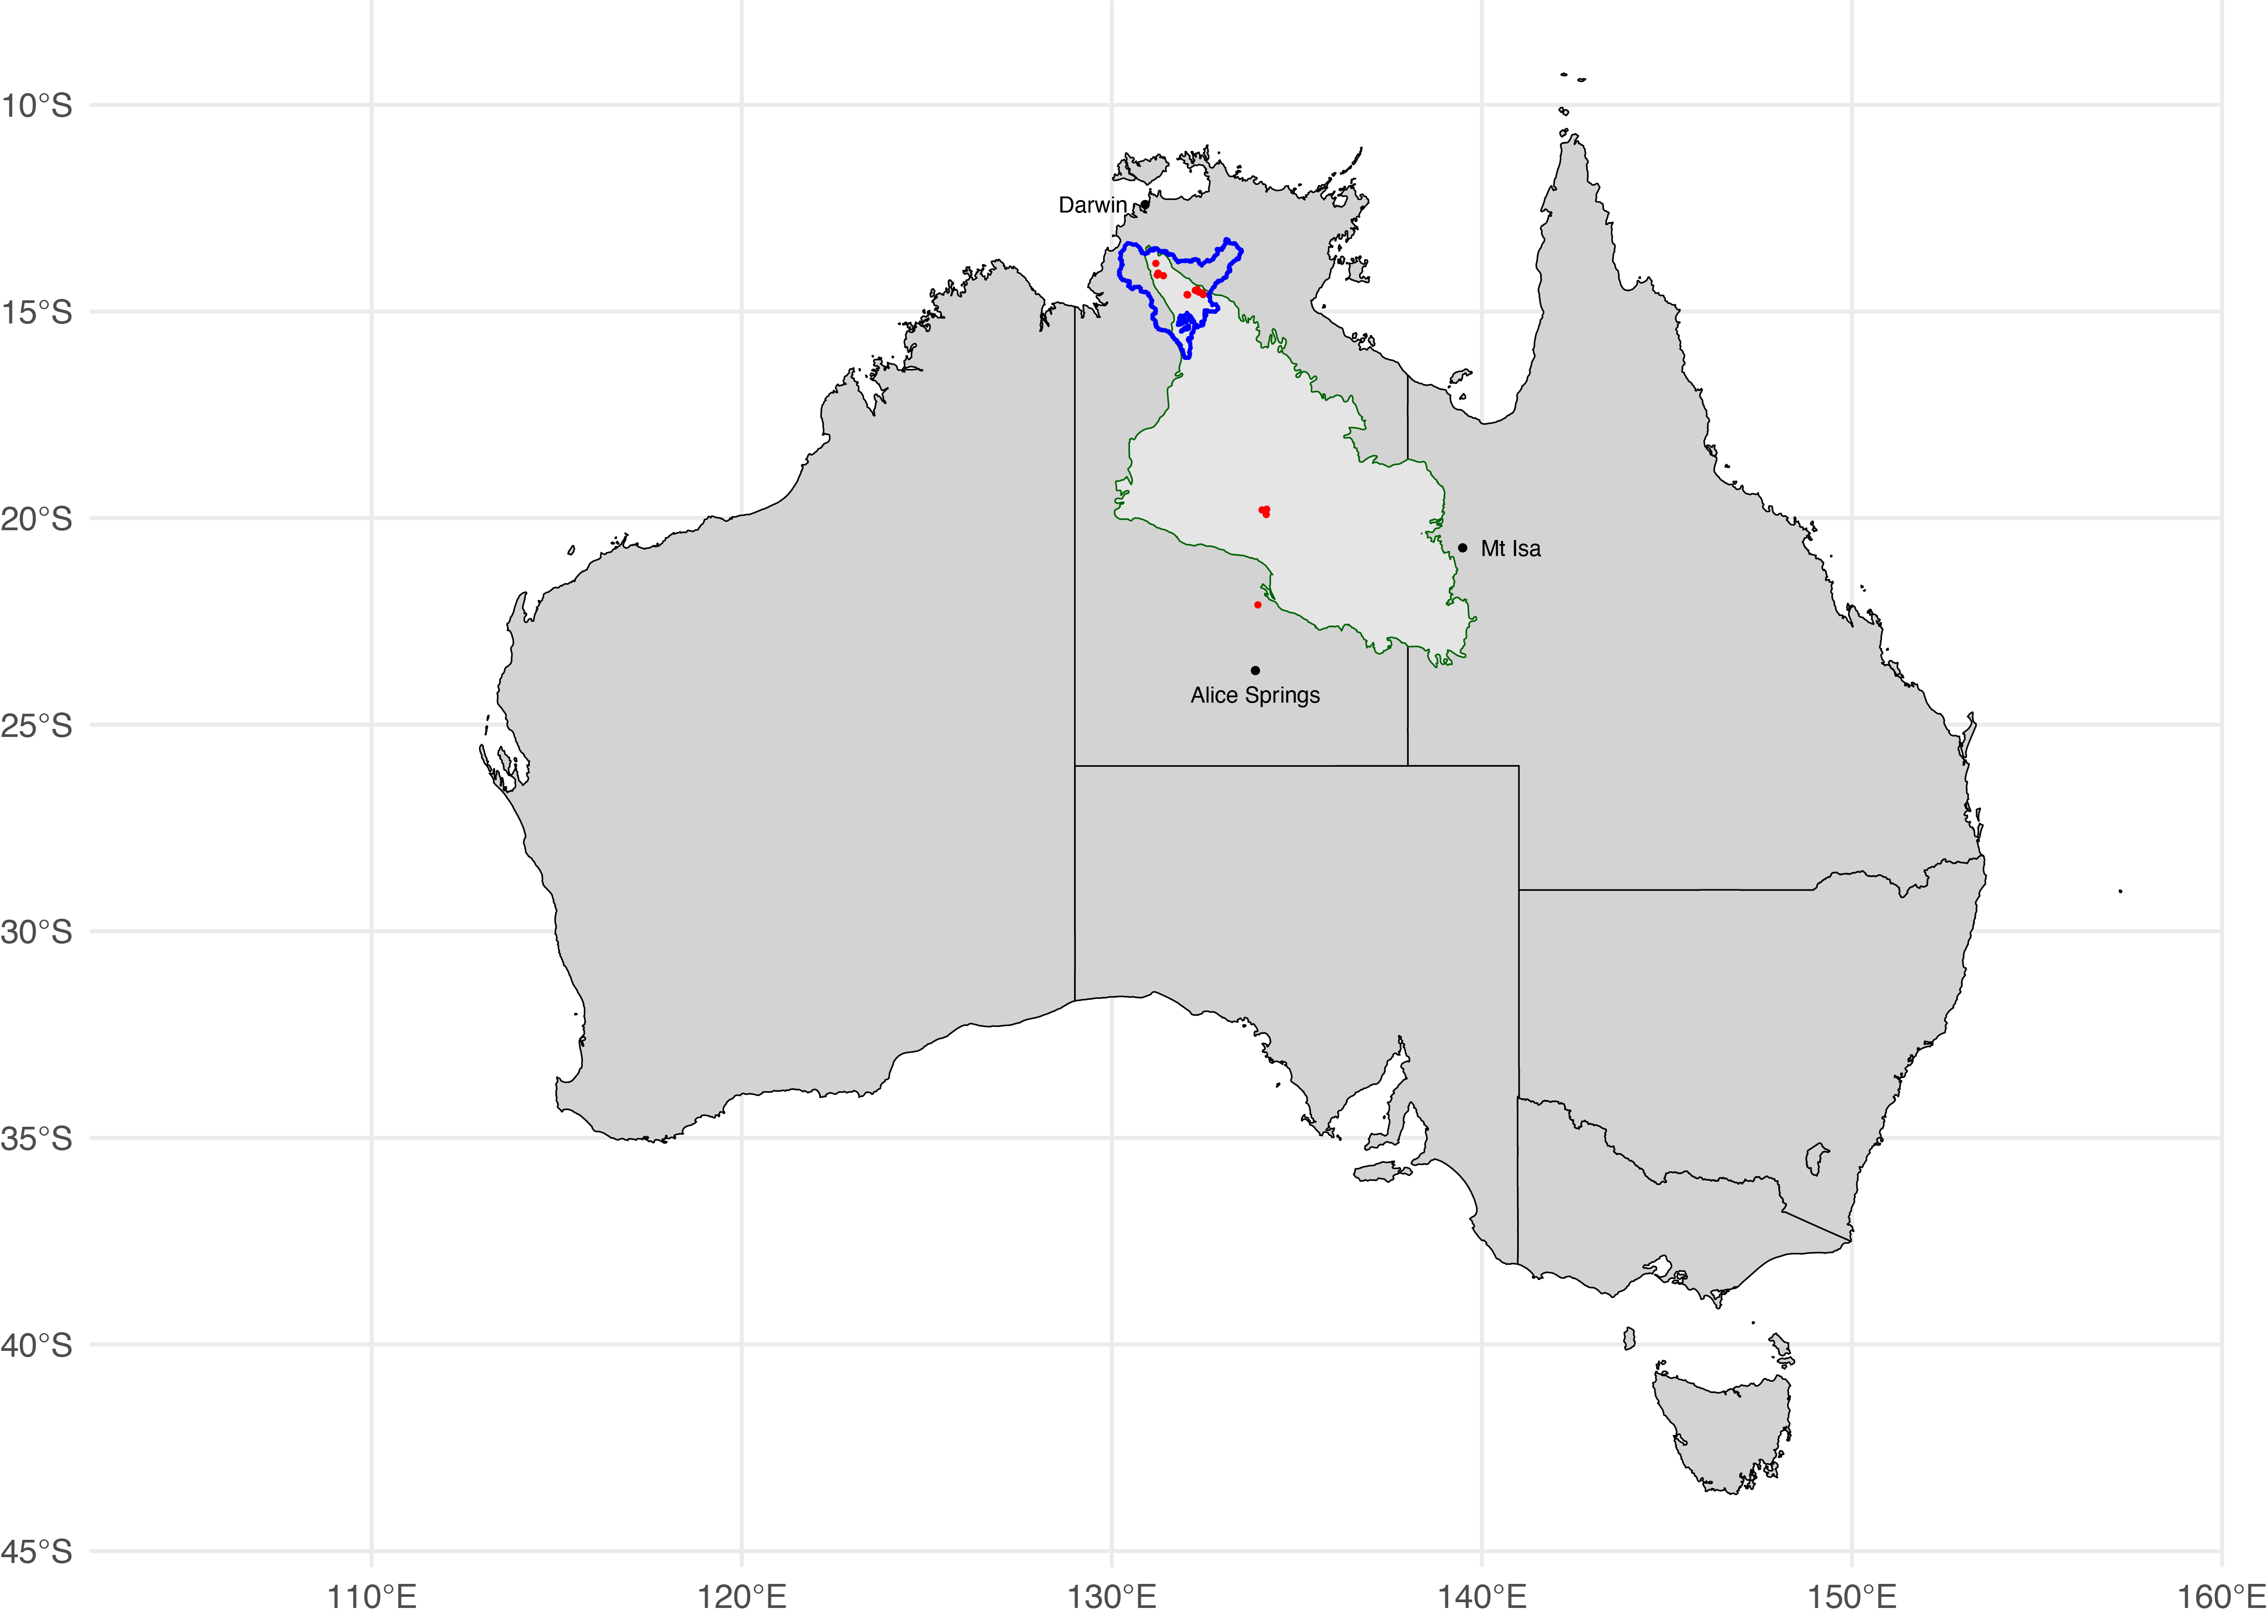
However, the Griffith University researchers do not fully account for all the uncertainties from their methodological choices. A particular problem is their failure to account for uncertainties introduced by the design effect in their use of a small number of monitoring bores to validate their groundwater change estimates. The limited bore sample is material because bore series are not independent, particularly if they are clustered in a relatively small area (Figure 3): they share climate signals and often aquifer‑unit responses. When observations are correlated (in time or in space), the effective sample size drops and uncertainty rises, large errors are possible if this is not accounted for (Lanzante, 2021). Similarly, extrapolating across the area of the Cambrian with multiple geological formations with different specific yields introduces significant, unaccounted for uncertainties. The article’s public materials do not document propogation of such uncertainties and the reported significance levels are likely too optimistic. Properly accounting for these uncertainties would likely further weaken any claims of a significant drying in Cambrian aquifers outside natural variation.
Selected references
- Ndehedehe, C. E., et al. (2025). Tracking freshwater depletion in Northern Australia: A multi-satellite approach. Ecological Informatics.
- Knapton, A. (2024). Daly-Roper River Model (DR3) Recalibration. NT Government.
- Taylor, A. R., et al. (2023). Hydrogeological assessment of the Cambrian Limestone Aquifer. CSIRO.
- Leblanc, M. J., et al. (2009). Basin-scale observations of the multiyear drought in southeast Australia. Water Resources Research.
- Murray-Darling Basin Authority (2025). The Basin. https://www.mdba.gov.au/basin#:~:text=More%20than%202.4%20million%20people,of%20native%20and%20migratory%20birds.
- Murray-Darling Basin Authority (2024). 2022–23 Water Take Summary Report, Murray‒Darling Basin Authority Canberra.
- Taylor AR, Crosbie RS, Turnadge C, Lamontagne S, Deslandes A, Davies PJ, Barry K, Suckow A, Knapton A, Marshall S, Hodgson G, Tickell S, Duvert C, Hutley LB and Dooley K (2023) Hydrogeological assessment of the Cambrian Limestone Aquifer and the Dook Creek Aquifer in the Roper catchment, Northern Territory. A technical report from the CSIRO Roper River Water Resource Assessment for the National Water Grid. CSIRO, Australia.
- Weatherhead, E.C., Reinsel, G.C., Tiao, G.C., Meng, X.L., Choi, D., Cheang, W.K., Keller, T., DeLuisi, J., Wuebbles, D.J., Kerr, J.B. and Miller, A.J., 1998. Factors affecting the detection of trends: Statistical considerations and applications to environmental data. Journal of Geophysical Research: Atmospheres, 103(D14), pp.17149-17161.
- Mudelsee, M., 2019. Trend analysis of climate time series: A review of methods. Earth-science reviews, 190, pp.310-322.
- Hannaford, J., Buys, G., Stahl, K. and Tallaksen, L.M., 2013. The influence of decadal-scale variability on trends in long European streamflow records. Hydrology and Earth System Sciences, 17(7), pp.2717-2733.
- BOM/CSIRO. 2024. State of the Climate 2024.
- BOM (Bureau of Meteorology) (2023). Australia’s 2022–23 northern wet season. https://www.bom.gov.au/climate/current/season/tropics/archive/202304.summary.shtml
- BOM (Bureau of Meteorology) (2024). Australia’s 2023–24 northern wet season. https://www.bom.gov.au/climate/current/season/tropics/archive/202404.summary.shtml
- Landerer, F.W. and Swenson, S.C., 2012. Accuracy of scaled GRACE terrestrial water storage estimates. Water resources research, 48(4).
- Kalu, I., Ndehedehe, C.E., Ferreira, V.G., Janardhanan, S., Currell, M. and Kennard, M.J., 2024. Statistical downscaling of GRACE terrestrial water storage changes based on the Australian Water Outlook model. Scientific Reports, 14(1), p.10113.
- Lanzante, J.R., 2021. Testing for differences between two distributions in the presence of serial correlation using the Kolmogorov–Smirnov and Kuiper’s tests. International Journal of Climatology, 41(14), pp.6314-6323.
- Thomas, B.F., Famiglietti, J.S., 2019. Identifying Climate-Induced Groundwater Depletion in GRACE Observations. Sci Rep 9, 4124. https://doi.org/10.1038/s41598-019-40155-y